Our Quality and TechnologyOur products are built on advanced technological principles that ensure high-quality signal acquisition and data integrity for a wide range of applications.
This page provides an overview of the key technological features of our products, including their design, functionality, and how they contribute to precise and reliable measurements in electrophysiological research.
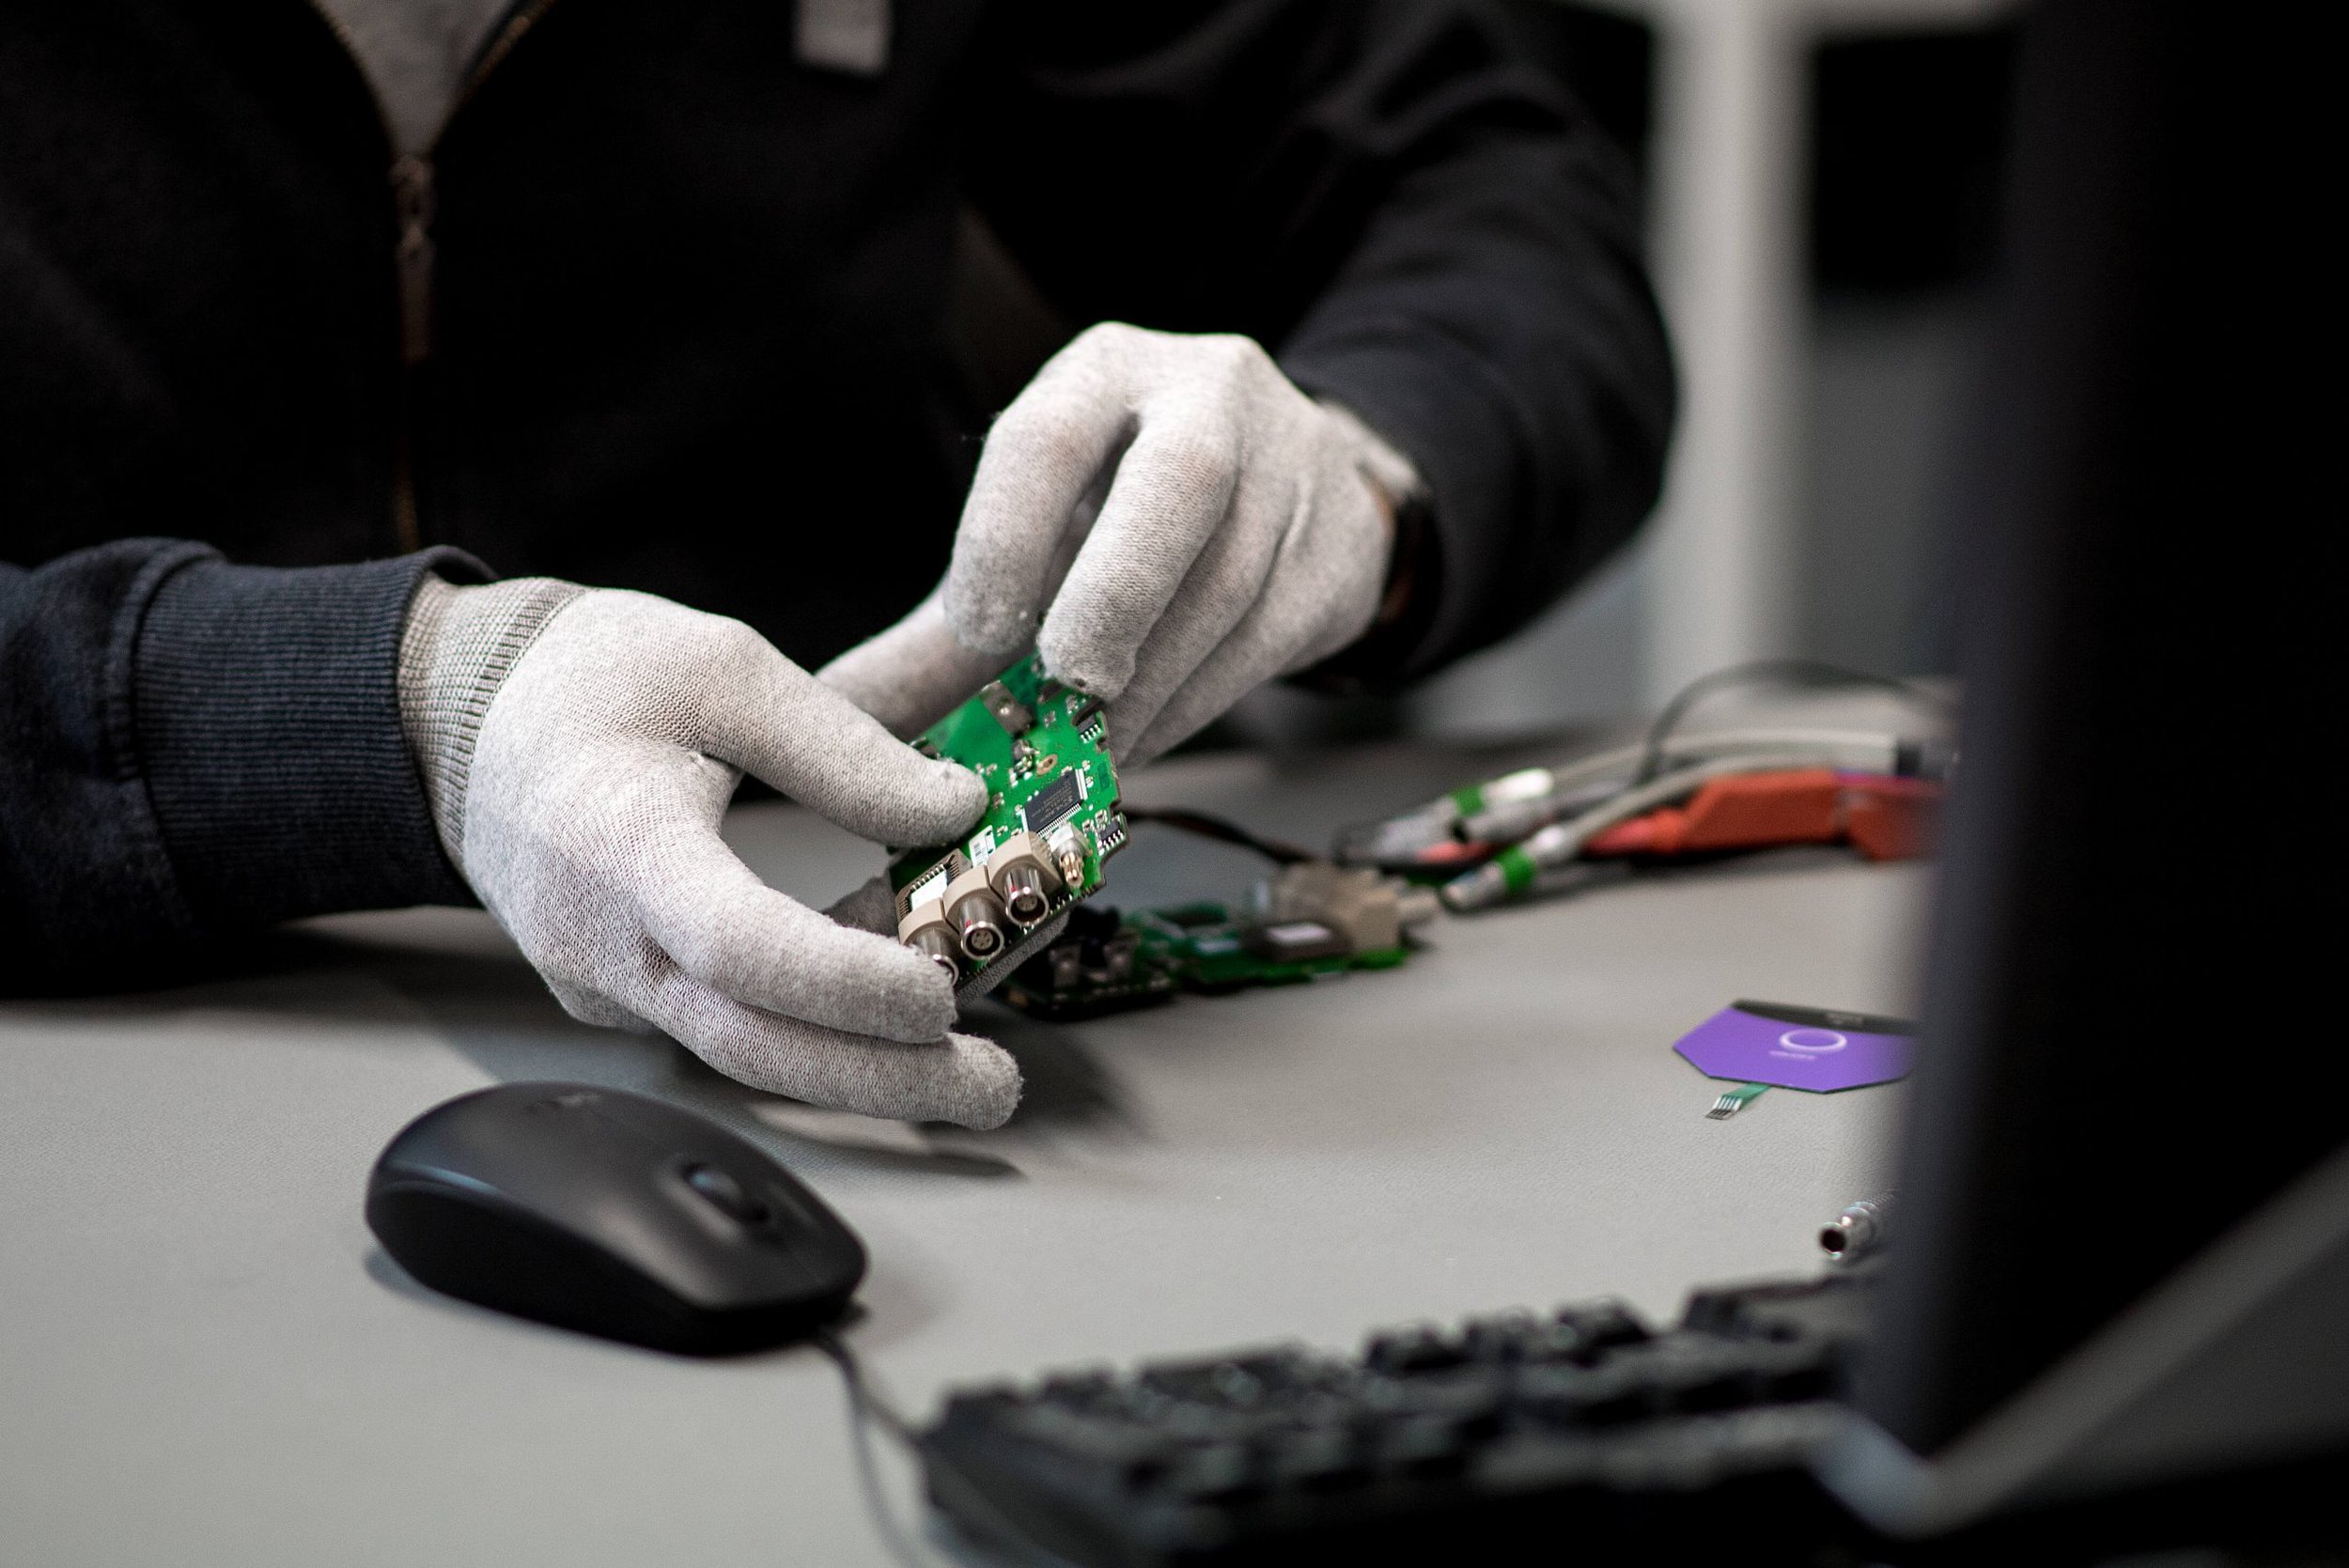
Technology You Can Trust
We are proud to be certified to ISO 13485:2016 for our quality management system, following a rigorous audit by the notified body Dekra. ISO 13485:2016 is the internationally recognized standard for quality management systems in the medical device industry. This certification signifies Artinis Medical Systems’ commitment to maintaining the highest level of device quality control and meeting both customer expectations and international regulatory requirements.
Active Shielding: Each lead is shielded by the signal itself utilizing a small coaxial cable. This solves two issues: the mains interference cannot reach the core of the lead, meaning that there is no capacitive coupling of the mains on the cable. The second issue that will be solved is the cable movement artifact.
Reduced triboelectricity through using selected cable materials and surface treatments to reduce cable movement effects.
An amplifier with high input impedance and low input capacity to obtain good signal quality from electrodes with higher impedances. This also increases common mode rejection when spread exists between electrode impedances.
A DC amplifier to measure extremely low frequencies, with fast signal recovery from movement artifacts and stimulation.
24-bit resolution, which includes the DC component maintaining a resolution of 20 nV.

Why TMSi-Brand Products?
Through years of experience and dedicated research and development, we have developed advanced technologies that ensure our products remain at the forefront of innovation, enabling your research to do the same.
An average reference is an artificial reference, which means a common reference is no longer needed (difficult to find a good position, fewer cables, eliminate noise sources between common reference and measurement location), at the same time improving signal quality.
High common mode rejection, which measures reliably in environments with high interference or with bad electrode conditions.
Impedance measurement at representative frequency, allows the user to optimize the skin-electrode interface.
Ag/AgCl electrode material, which has a constant offset (half-cell potential), compared to other materials. With no polarization and a large effective surface, measurements are stable and signals stay in range.
Pico coax cable with optimal cable characteristics, which reduces cable weight.
Check the Data for Yourself
The Textile HD-EMG grids deliver high-quality HD-EMG signals with exceptional precision. To showcase their performance, we provide three example recordings, enabling you to verify the outstanding data quality for yourself.
What was recorded?
The HD-EMG measurement has been done using the 8-8-L Textile Grid (8x8 topology, 8.75 mm IED) on the gastrocnemius muscle, see Figure 1. The 64-channel grid covers both the medial and lateral head to show the flexibility of the grid. The grid can also be cut in half, in two 32-channel variants to cover each head more precisely.
What does the data show?
Below, two types of analysis of the data are shown. Figure 1 shows the average power frequency spectrum of the raw signal of all 64 channels for the three measurements. In the recordings where muscle activity was recorded (constant calf raise and squat jumps), no mains interference can be seen. For the "rest” condition, as there is no muscle activity present and therefore lower power in general, there are small peaks at 50 Hz.

Figure 1: Average frequency spectrum of the sample data during rest, constant calf raise, and squat jumps.


Figure 2: Single row of raw HD-EMG data showing two squat jumps.
Figure 2 shows four seconds of squat jump data from a single row of channels. Pre-processing only included the removal of the offset with no further filtering. In the plot, you can see that the signal remains stable when jumping and when landing.
How can I view or analyze the data myself?
To view the data, you can import the recordings into our file viewer. To perform data analysis, you can use TMSi Python interface to import the recordings into Python. Please follow the installation instructions in the Documentation TMSi Python Interface. After installation, you can load the data into Python with the example script example_file_reader.py in the folder examples_reading_data of the TMSi Python Interface.